

|
|
|
CD Start Page | DATA ACQUISITION ONLINE Page | DATA ACQUISITION PRODUCTS Page |
Automated Equation Discovery and Fitting
Whether you need to evaluate empirical data or test a theoretical model, generate a calibration curve or model a lookup table, there are only two programs that can save you weeks of trial and error data fitting: TableCurve 2D and TableCurve 3D.
TableCurve is the first and only software program that combines a powerful equation generator and a curve fitter in one complete product. Use TableCurve to fit your theoretical models to a data set using the user-defined editor. Or use the equation generator to automatically select and rank best fit equations for calibration, process optimization, and interpolation analysis. With one mouse click, TableCurve 2D can fit 3,656 linear and non-linear equations in 2.87 seconds on a Pentium 90. Or use TableCurve 3D to surface fit from over 450 million equations in 32 seconds! With TableCurve, you discover complex equations you would have never thought of.
Best of all, you're the boss. You select the equation sets you need to run. You can provide User Defined Functions (UDFs), set parameters, and review and modify the fitted curves. And you select the best fit equations for your particular needs. No other curve-fitting program gives you this much versatility and power.
TableCurve also generates graphs, statistics, and actual program code; and it lets you easily import and export data from popular Windows applications. This makes it the ideal tool for researchers in just about any field.
Generate calibration curves...
Use TableCurve to create calibration curves for flow meters to compare instrument readings with actual measurements or to model the influence of temperature and viscosity on equipment readings.
Optimize process control...
One TableCurve 3D user modeled operations at his power plant by monitoring cooling pond levels and temperatures vs. cost. He then generated an equation that would let him operate the plant at maximum efficiency, saving the company millions of dollars.
Fit tabulated data...
Convert any table you find in a product manual or an engineering or pure physical sciences book into a series of curves. These curves can then be plugged in to your other research, equipment, or software applications.
Model experimental data...
Including almost any experiment that generates a 2D or 3D table. You can then explore different fits, including some you may not have thought of.
Interpolate data points...
There is no simpler, faster or more automated way to interpolate points along a fitted curve. TableCurve can generate a data table or an individual point for interpolation.
Create black box models...
You don't have to know the underlying science to model a difficult process or understand the process itself. TableCurve still lets you model the inputs and outputs (black boxing). For instance, in fitting emulsion polymerization data, TableCurve can fit initiator levels, surfactant levels and reactant temperatures relative to the final particle size to produce polymerized clumps of almost any size.
Generate logistic dose response curves...
Pharmacological researchers will appreciate TableCurve 2Ds built-in logistic dose response model, which can model processes like concentration vs. time and dose.
Measure the thermal conductivity of substances...
Use TableCurves built-in peak functions to profile the thermal conductivity of different substances as a function of temperature. One example: assessing insulating properties vs. the cost of building materials. Or analyze kinetic data analysis.
TableCurve's built-in kinetic functions help you study reactions and describe biochemical responses. Kinetic functions can be used to study the disappearance of a reactant (decay) and the appearance of a product (formation) over time. Only TableCurve's kinetic model can determine the actual order of the formation or decay.
Both TableCurve 2D and TableCurve 3D feature new 32-bit architecture for ultra-fast performance. How fast? In a single, highly automated and rapid processing step, TableCurve 2D selects from up to 3,656 candidate questions for your X,Y data sets to find the best equations for your data in seconds. TableCurve 3D automatically selects from up to 453,697,387 candidate equations for your X,Y,Z data sets. Equations are ranked by the criteria you select (R2, DOF Adjusted R2, Root MSE or F Statistic).
And as you step through the ranked list of best-fit equations, the corresponding graph automatically updates and lets you visually select the best fit equations. For quicker processing, select one of nine pre-defined equation groups to process. And for peak, transition, and kinetic functions in TableCurve 2D, the AI expert option scans the data profile, suggesting the equation set and controls to process.
Or you can enter your own equations and rank them along with the built-in equations. Up to 15 UDFs can be added at any one time and conveniently stored in a library. Its easy to visually adjust the parameters on-screen with a scroll bar or add the actual value. And for a rapid pre-fit, you can click the Find and Adjust button to automatically find the best fit starting estimates. UDFs are compiled for the fastest possible fitting and are transparently added to the set of pre-defined equations.
Enter or import ASCII files, DIF files, Lotus 1-2-3, Excel, Quattro Pro, SigmaPlot or dBASE files. The table editor, which functions like a spreadsheet, offers options such as auto-entry, sorting, and data graphing as values are input. On-screen graphical editing of data allows you to activate points, directly apply calculations, and produce up to 2 overlay reference graphs for comparing data sets. And for noisy data, TableCurve 2D offers four smoothing methods.
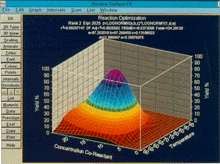
Reviewing your selected equation list couldn't be easier. Customize labels and titles and color code points to denote the number of standard errors from the curve or surface. Even display confidence or prediction intervals of 90, 95, and 99%. Other options include customizable backplanes, grids, and labels. TableCurve 3D also comes with adjustable view and illumination angles and contour plots.
Generate Program Code.
Both programs can speed up your programming by generating actual function code and full test routines for all equations in C, FORTRAN, Pascal, and Visual Basic and QBasic.
With all this power, TableCurve is still easy to use!
As true Windows applications, both TableCurve 2D and TableCurve 3D take full advantage of the graphical user interface to simplify every aspect of operation. Users consistently comment that out of the box, without reading the instructions TableCurve 2D and TableCurve 3D are highly intuitive, easy to use, and remarkably simple to learn.
VIEW an Adobe Acrobat pdf file for more product info (requires Acrobat Reader).
|
| |||||


